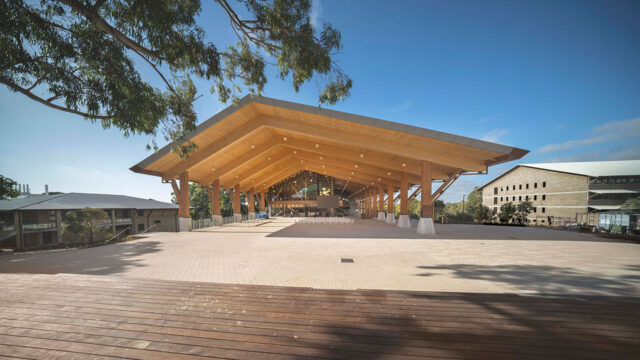
We are changing lives through science, technology, and innovation. Our goal is to improve the lives of 1 billion people around the world by 2030 by helping to create more resilient and sustainable communities. Learn more about our commitment.
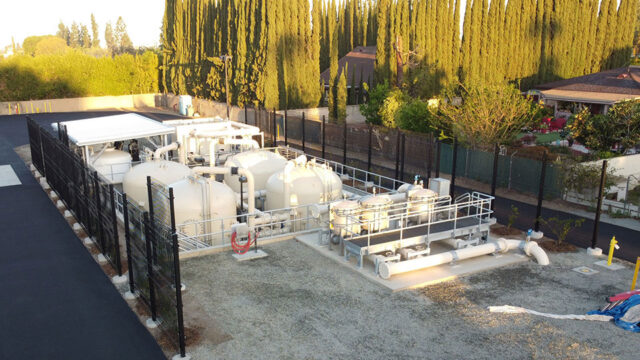
Strengthening safe water supplies in communities around the world
We help address mounting water challenges due to climate change impacts, emerging contaminants, and population pressures.
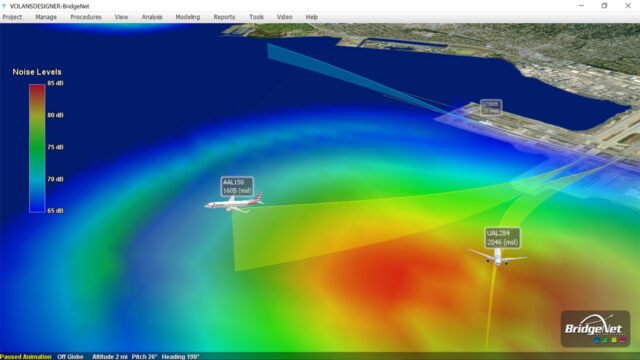
Our Tetra Tech Delta suite of digital solutions encompasses advanced data analytics, artificial intelligence, and technologies that create transformational solutions for our clients.
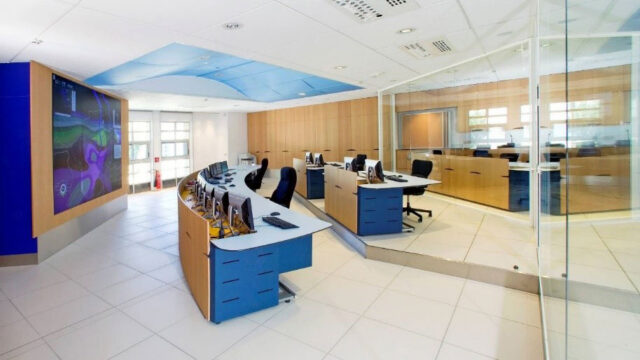
Our world-class engineers and scientists leverage industry-leading technical expertise, in-depth local knowledge, and sustainable approaches to provide resilient solutions for our clients.